
Signal K, stream data changes
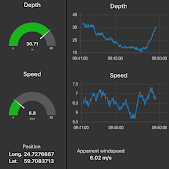
Updated 2025-06-28 ! Are You searching for a solution where You want to create graphs and gauges from SignalK(SK) data ? Use NodeRed(NR), installed as a SK plugin , with the standard dashboard and it's easy to create info as seen in the picture. And this is without a database as InfluxDB and tools like Grafana. You use the WebSocket interface , or SK subscribe nodes, to subscribe to changes in data from the SK server.


